Ever stood next to your WiFi router, saw -50 dBm RSSI (Excellent), but still faced buffering
videos, slow downloads, or glitchy calls?
What’s going wrong?
Here’s the truth:
A good RSSI doesn’t guarantee good performance. Let’s break down why:
![]() Interference Overload:
Interference Overload:
Nearby WiFi networks, Bluetooth devices, microwaves, or wireless cameras flood the
airwaves. Even with a strong RSSI, your signal gets drowned in noise.
![]() Channel Congestion:
Channel Congestion:
You’re on a crowded channel. Even though your RSSI is strong, your device is waiting in
line to talk — like being stuck in traffic.
![]() Low SNR (Signal-to-Noise Ratio):
Low SNR (Signal-to-Noise Ratio):
RSSI tells you how loud your signal is. But it doesn’t tell you how noisy the background is.
High noise floor = poor SNR = poor performance.
![]() Airtime Utilization:
Airtime Utilization:
Your AP may have a strong signal, but it’s overloaded with devices. All that strong RSSI
can’t save you if there’s no airtime left for your data.
![]() Backhaul Bottleneck:
Backhaul Bottleneck:
Even if the WiFi link is perfect, the AP’s wired uplink to the internet may be congested.
Great RSSI won’t fix a bad backhaul.
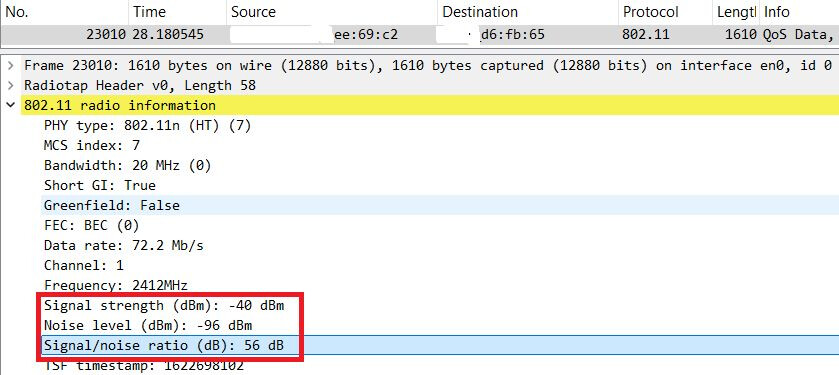
![]() Real-World Proof — From a Wireless Sniffer Log
Real-World Proof — From a Wireless Sniffer Log
Here’s a real capture we analyzed during a slow WiFi complaint:
![]() RSSI = -52 dBm (Excellent Signal)
RSSI = -52 dBm (Excellent Signal)
![]() Channel Utilization = 88% (Severely Congested)
Channel Utilization = 88% (Severely Congested)
![]() Retry Rate = 47% (Almost 1 in every 2 frames needed a retry)
Retry Rate = 47% (Almost 1 in every 2 frames needed a retry)
![]() Noise Floor = -80 dBm (High Noise)
Noise Floor = -80 dBm (High Noise)
![]() Result? Terrible experience despite “Full Bars.”
Result? Terrible experience despite “Full Bars.”
Here’s a quick cheat sheet:
![]() RSSI: Good: -30 to -60 dBm | Bad: Below -70 dBm
RSSI: Good: -30 to -60 dBm | Bad: Below -70 dBm
![]() Noise Floor: Good: ≤ -90 dBm (2.4GHz), ≤ -92 dBm (5GHz) | Bad: Closer to -80 dBm
Noise Floor: Good: ≤ -90 dBm (2.4GHz), ≤ -92 dBm (5GHz) | Bad: Closer to -80 dBm
![]() SNR: Good: > 30 dB (Excellent) | Bad: < 20 dB (Trouble)
SNR: Good: > 30 dB (Excellent) | Bad: < 20 dB (Trouble)
![]() Channel Utilization: Good: < 50% | Bad: > 80%
Channel Utilization: Good: < 50% | Bad: > 80%
![]() Retry Rate: Good: < 10% | Bad: > 30%
Retry Rate: Good: < 10% | Bad: > 30%
![]() Key Takeaway:
Key Takeaway:
Next time WiFi feels slow, don’t just look at RSSI. Check:
![]() SNR
SNR
![]() Noise Floor
Noise Floor
![]() Channel Utilization
Channel Utilization
![]() Retry Rate
Retry Rate
![]() Airtime Utilization
Airtime Utilization
![]() Key Takeaway:
Key Takeaway:
![]() RSSI alone is misleading — always check SNR, Noise Floor, Channel Utilization & Retry
RSSI alone is misleading — always check SNR, Noise Floor, Channel Utilization & Retry
Rate.
![]() A quiet spectrum matters more than just a strong signal.
A quiet spectrum matters more than just a strong signal.
LinkedIn: ![]()