Ever wondered why your WiFi sometimes slows down even when you’re connected?
One key factor is RSSI (Received Signal Strength Indicator). It determines how well your device receives the WiFi signal, impacting speed, stability, and roaming.
![]() Understanding RSSI Values
Understanding RSSI Values
RSSI is measured in dBm (decibels relative to 1mW) and typically ranges from -30 dBm (excellent) to -90 dBm (unusable). Here’s a quick guide:
![]() -30 dBm to -50 dBm → Excellent (Fast & stable connection)
-30 dBm to -50 dBm → Excellent (Fast & stable connection)
![]() -51 dBm to -65 dBm → Good (Reliable for video streaming)
-51 dBm to -65 dBm → Good (Reliable for video streaming)
![]() -66 dBm to -75 dBm → Fair (Okay for web browsing)
-66 dBm to -75 dBm → Fair (Okay for web browsing)
![]() -76 dBm to -90 dBm → Poor (Unstable, expect dropouts)
-76 dBm to -90 dBm → Poor (Unstable, expect dropouts)
![]() Myth Busting: A strong RSSI doesn’t always mean great performance! Interference, congestion, and noise also affect WiFi quality.
Myth Busting: A strong RSSI doesn’t always mean great performance! Interference, congestion, and noise also affect WiFi quality.
![]() How to Check Your RSSI?
How to Check Your RSSI?
![]() Windows → Open CMD and type: netsh wlan show interfaces
Windows → Open CMD and type: netsh wlan show interfaces
![]() Mac → Hold Option + Click WiFi Icon
Mac → Hold Option + Click WiFi Icon
![]() Mobile → Use WiFi Analyzer Apps
Mobile → Use WiFi Analyzer Apps
![]() How RSSI Affects Your WiFi?
How RSSI Affects Your WiFi?
![]() Stronger RSSI = Higher speeds & lower latency
Stronger RSSI = Higher speeds & lower latency
![]() Weak RSSI = More retries, slow connection, dropouts
Weak RSSI = More retries, slow connection, dropouts
![]() Roaming Decisions → Enterprise networks use RSSI to shift devices between APs
Roaming Decisions → Enterprise networks use RSSI to shift devices between APs
![]() How to Improve WiFi Based on RSSI?
How to Improve WiFi Based on RSSI?
![]() Place your router/AP centrally for better coverage
Place your router/AP centrally for better coverage
![]() Use external antennas to boost signal direction
Use external antennas to boost signal direction
![]() Adjust transmit power to optimize coverage & roaming
Adjust transmit power to optimize coverage & roaming
![]() Avoid interference (Use non-overlapping WiFi channels)
Avoid interference (Use non-overlapping WiFi channels)
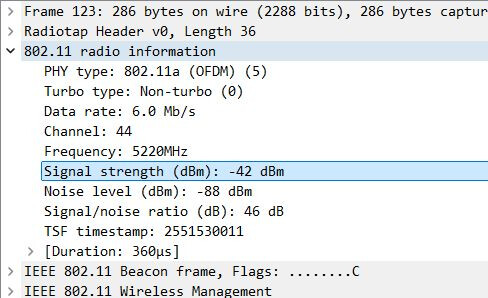
![]() RSSI in Action: WiFi Sniffer Analysis
RSSI in Action: WiFi Sniffer Analysis
Want to dive deeper? Wireshark captures RSSI in real-time!
![]() Look for the Radio Information → Signal Strength field to analyze RSSI per packet.
Look for the Radio Information → Signal Strength field to analyze RSSI per packet.
LinkedIn: ![]()